Tuesday, August 28, 2007

Applications Manager from ManageEngine

ManageEngine Applications Manager is an Availability and Performance Management Solution that proactively monitors Business Applications and help enterprises ensure that their web applications meet end user expectations.


For more information click on link below -


Wednesday, August 22, 2007

Management Pack Schema

Did You Know


Argent Predictor

The Argent Predictor is a comprehensive capacity planning, trend analysis and reporting solution. While monitoring the rate of consumption of critical resources, the Argent Predictor is able to produce graphs and analysis from any data source including disk space, CPU utilization, SQL log sizes, Exchange and IIS usage. Monitoring and truly understanding the workload a system is capable of handling in a given period of time allows the meeting of current and future demands with minimal surprises. The Argent Predictor analyzes long-term movement, allowing more effective planning for the future. The Argent Predictor also provides Service Level Agreements so that the efficiency and uptime of critical devices such as servers, hubs and routers can be rated to better support business units.

Key Features And Benefits
Built-in Service Level Agreement ReportingThe Argent Predictor provides powerful and flexible Service Level Agreement reports and graphs, showing the reliability and efficiency of critical servers and devices - their uptime and reliability over a period of days, weeks, or months.

Select The Database That Best Fits
The Argent Predictor saves capacity planning data to a customer's SQL Server, Oracle, or any ODBC database.

Completely Integrated With The Argent Guardian
The Argent Predictor is fully integrated with the rest of Argent's product line - there is no learning curve for users.

Advanced Features Make The Argent Predictor Unique
The Argent Predictor has a large number of extremely powerful advanced features such as Automatic Report Distributions, Calendaring, and advanced 2D and 3D graph customization. Quick Reports are available, providing "executive level" web-based reports. Reports are automatically generated and can be emailed, exported, or uploaded into a designated FTP site at pre-defined times.

Fully Customizable Under Crystal Reports
The Argent Predictor's graph templates interface directly with Crystal Reports, providing the ability to customize reports in various ways, such as adding company headers and logos, and modifying layouts.
For more information click on the link below -


Oracle Tuning Tools

Ignite™ for Oracle Performance

Confio Software is revolutionizing the way enterprises monitor, analyze and optimize their databases and applications. Developed for Oracle DBA?s, managers and developers, Confio's Ignite for Oracle performance solution enables organizations to optimize service levels for IT end-users and reduce total cost of operating infrastructure.

Actionable Data At An SQL Statement Level
Confio Ignite for Oracle performance tool offers DBAs unparalleled insight into the true sources of Oracle database performance issues that affect IT systems and customer service levels. Unlike other Oracle performance management solutions that take a snapshot of a single session at one point in time, Ignite for Oracle shows all sessions all of the time, monitoring databases from a single repository on a 24/7 basis. Analysis is based on Wait-time methodology so problems can be isolated to specific SQL statements, which provide the deepest and most actionable level of performance detail. Performance impacts can also be investigated without needing to re-create the problem. DBAs can access trend reports spanning weeks, months or years to conclusively demonstrate performance changes, improvements, and impacts of new applications.

Precise Problem Origination
Ignite for Oracle performance management provides a level of visibility into Oracle performance problems that eliminates vagueness and ambiguity regarding the root cause and owner of inefficiencies. Oracle performance issues can be traced to a departmental level so the appropriate owners can be engaged, such as the application owners, developers, DBAs, system and network admins, consultants or outside vendors.


Optimized customized impact
Unlike traditional Oracle performance management tools that focus only on internal IT impact, Ignite for Oracle?s proactive monitoring is designed to optimize the impact on the customer experience, the most relevant goal of performance analysis. Custom alerts and notifications empower DBA?s to quickly address mission-critical problems and minimize or eliminate customer impact.
Confio Ignite for Oracle's Wait-Time approach to analysis measures the time spent waiting on each Oracle resource, illuminating causes of database and SQL statement delays. By isolating bottlenecks inside the statement layer, improvements can be quickly identified and addressed. Impacts can be tracked over time to gauge effectiveness of modifications.


Agentless Operation
Ignite for Oracle performance management requires no installed software on the production server so performance tool contributes no load or process burden on the server.

for more information on the product please click on the link below -
http://www.confio.com/opt2_oracle_tuning_tools.php

Sunday, August 19, 2007

Bigger Monitor, Same Space


I could have an EIGHT-foot monitor, and I still wouldn't have anywhere to fit my MSN Messenger window!


zabbix - 1.4

ZABBIX offers functionality that will make your IT resources look more transparent, and it will also help to easily identify performance and availability problems. ZABBIX greatly increases the productivity of system administrators by providing simple-to-use monitoring system.


Key features
*Open Source solution
*Runs on AIX, FreeBSD, HP-UX, Linux, MacOS X, NetBSD, OpenBSD, Solaris, Tru64/OSF
*SQL database for storing configuration, collected data and trends
*Web interface offers minimal learning, ubiquitous access
*Instant drill down from real-time status of IT Services to historical trend and statistics
*Data visualisation and mapping
*High performance native ZABBIX agents for performance and integrity monitoring for virtually all platforms (UNIX, Win32)
*Monitoring of "agentless" environments
*Assuring and monitoring SLA for IT Services
*Monitoring of SNMP (v1,v2,v3) devices


IT Services
ZABBIX's unique technology allows you to relate your applications and underlying servers or network to a IT Service such as application, location, server, network device, region, etc. This technology allows you to correlate your business to your IT infrastructure and identify the impact of your IT infrastructure to the delivery of business service to your customers.

Data visualisation
ZABBIX provides excellent visualisation of statistical and real-time information, ranging from simple graphs to complex views containing graphs, maps and text information. All graphical information is accessible from WEB interface. The wealth of information available such as the trend analysis (days to threshold), the historical graphs and histograms allow you to make informed decisions about the weaknesses and performance of your IT infrastructure.

Application monitoring
Enterprise applications such as Oracle, WebSphere, WebLogic, Exchange, Apache, etc. can be monitored using SNMP. In many cases, agentless technology can be used, cutting down on the deployment and management costs.
ZABBIX agents can be easily extended to perform monitoring of any aspect of your applications. It is matter of writing a shell script which would return required data back to the agent.


Server monitoring
Virtually all server platforms are supported including but not limited to UNIX, Win32 and Novell Netware. ZABBIX native agents take care of CPU utilisation, memory utilisation, disk usage, network I/O, temperature of CPUs and mainboards, status of processes, etc. All real-time performance data is immediately available by WEB interface.

Network monitoring
ZABBIX supports monitoring of Cisco, Juniper, 3Com, Nortel, Foundry and other routers as well as firewalls from Netscreen, Fortinet, Cisco or Checkpoint. Any network devices (routers, hubs, printers, etc) having SNMP support can be easily monitored by ZABBIX.
ZABBIX makes possible creation of network maps which give very clear representation of monitored network infrastructure. The maps show network devices, connections, statuses of the devices, and reasons if a device is not available or has any problems.


Integration of Fault and Performance Management
The need to effectively integrate fault and performance management is becoming increasingly apparent to IT organizations seeking to ensure quality delivery of business services. ZABBIX generates real-time notification of threshold violations based on scheduled performance tests.

for more information - click on the link below -
http://www.zabbix.com/

ALERTIT

ALERT has been specifically designed to meet the operational and business management needs of companies and IT departments that develop and deliver IT products and services. The emphasis is on providing high levels of customer service while reducing costs through greater efficiencies. ALERT is an integrated system that manages the full project life cycle from initial customer request to delivery and billings. Projects form the hub of ALERT with all activities, both core and supporting, being managed by project. All business activities are linked to and managed by projects for the purpose of gaining control and visibility over the activities. ALERT management covers the following functions and activities:-
Resource planning / scheduling
Project planning and tracking
Time recording
Managing customer requests
Managing billings
Service delivery
Quoting and estimating Software production, testing and delivery
Research and development management
Profit and contribution control and analysis


For more information click on the link below -
http://www.alertit.com/whatisalert.htm

Thursday, August 9, 2007

Tam Tam Knowledge Browser

Tam Tam Knowledge Browser is Twiki on SharePoint Portal Server .

The Knowledge Browser is a customized knowledge base for SharePoint Portal Server 2003 that accommodates high-level navigating through a large collection of information by means of metadata.
One of the major advantages of SharePoint is that you can store various kinds of information (documents, lists, links and discussions) and establish relevant properties (metadata) to describe these information items for future retrieval. Unfortunately, the user interface of SharePoint 2003 doesn't make much use of this metadata yet for high-level navigation. Metadata is mainly used in the search function and on the lowest navigation level (inside a list or document library).


for more information click on the following link http://www.knowledgebrowser.net/


Monday, August 6, 2007

KPI’s in Microsoft Office SharePoint Server 2007

Key Performance Indicators (KPI’s) are metrics used to quantify objectives to reflect an organization's strategic performance. See the article at http://en.wikipedia.org/wiki/Key_performance_indicators for more information about KPIs.
Microsoft Office SharePoint Server 2007 has built in features that allow you to manage and display KPI information in various ways. KPI indicators can be derived from a SharePoint list, an Excel Workbook, data in Microsoft SQL Server 2005 Analysis Services and manually entered information. I'm going to show you how to create a KPI list and manually populate it with data.
Lets create a Sales Analysis KPI list and see what results can be displayed. To get started, choose a site that's currently not in production use, such as a private sub-site.

for more information goto - http://msd2d.com/Content/Tip_viewitem_03NoAuth.aspx?id=6baa8ed2-40b2-4ed4-b7c7-c7a646ca92d1&section=Sharepoint

Microsoft Dynamics CRM 3.0

What is Microsoft Dynamics CRM Analytics Foundation?
Microsoft Dynamics CRM Analytics Foundation is a business intelligence solution accelerator for Microsoft Dynamics CRM 3.0 customers and partners. With Analytics Foundation, executives can better track and manage business performance with dashboards and KPIs. Managers and employees can create reports quickly and make better decisions. Sales, marketing, and service employees can identify and act on new opportunities to grow revenue and improve business efficiency with predictive analytics. Analytics Foundation includes an OLAP cube (UDM) built on the default Microsoft CRM 3.0 schema, dashboards for sales and service, and predictive analytics such as product recommendation, lead potential rating, marketing list generation, and more. Analytics Foundation leverages data management and analytics technologies from the Microsoft Business Intelligence suite of products including SQL Server 2005, SharePoint, Business Scorecard Manager, Excel, and PerformancePoint Server 2007 (when available).

Service dashboard in SharePoint with scorecards, KPIs, and supporting reports

Ad-hoc reporting of Microsoft Dynamics CRM 3.0 data in Excel 2007. The spreadsheet is connected to Analytics Foundation OLAP cube (UDM).

click on the link below
http://msdn2.microsoft.com/en-us/library/aa972194.aspx

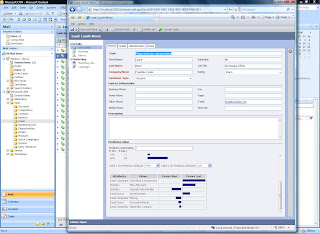
Predictive lead potential rating in Microsoft Dynamics CRM 3.0. Automatic scoring of leads is based on their likelihood to convert to successful opportunities.


Thursday, August 2, 2007

My New computer


Did You Know

The jvmstat technology adds light weight performance and configuration instrumentation to the HotSpot JVM and provides a set of monitoring APIs and tools for monitoring the performance of the HotSpot JVM in production environments. The instrumentation is designed such that it is 'always on', yet has negligible performance impact.

Xcelsius dashboards

Crystal Xcelsius and Crystal Xcelsius Workgroup are the new standard in interactive data visualization software.
With Crystal Xcelsius, you can transform your complex data into visually stunning dashboards, financial calculators, forecast reports, and much more.


*Point-and-click ease. Crystal Xcelsius' intuitive interface, including pre-built components, skins, maps and charts, and one-click export, make it easy for non-technical users to develop business dashboards in less than an hour.


*Custom graphics and interactivity allow you to develop and present compelling yet easy-to-understand financial reports, sales forecasts reports, and more. All this can be done via the Web, MS Office, MS SharePoint, Adobe PDF, and any environment that supports Flash.


*Visual modeling. Sliders, gauges, filters, numerical input tools, and other visual components allow you to quickly evaluate multiple "what-if" scenarios in real-time, with the click of a mouse.
*Platform independence.


Wednesday, August 1, 2007

Famous Quote

If you have an apple and I have an apple and we exchange apples, then you and I will still each have one apple. But if you have an idea and I have an idea and we exchange these ideas, then each of us will have two ideas.


- G.B Shaw